What is a Bell Curve in Performance Appraisal?
A Bell Curve in Performance Appraisal is a performance evaluation method that uses a normal distribution curve to classify employees into different performance categories. The approach assumes that most employees perform at an average level, while a smaller percentage are high performers and low performers.
Characteristics of a Bell Curve Graph
Understanding the Bell Curve Meaning
Bell Curve in detail for the Performance Management Process
HR or reporting managers use a bell curve to determine their top performers. They can easily divide their current workforce into 20 percent of their top performers, 70% of their average ones, and 10% into lower performers.
The graphical representation makes it easier to locate performers eligible for appraisals. This bell curve method helps both employees and employers grow and take corrective action whenever required.
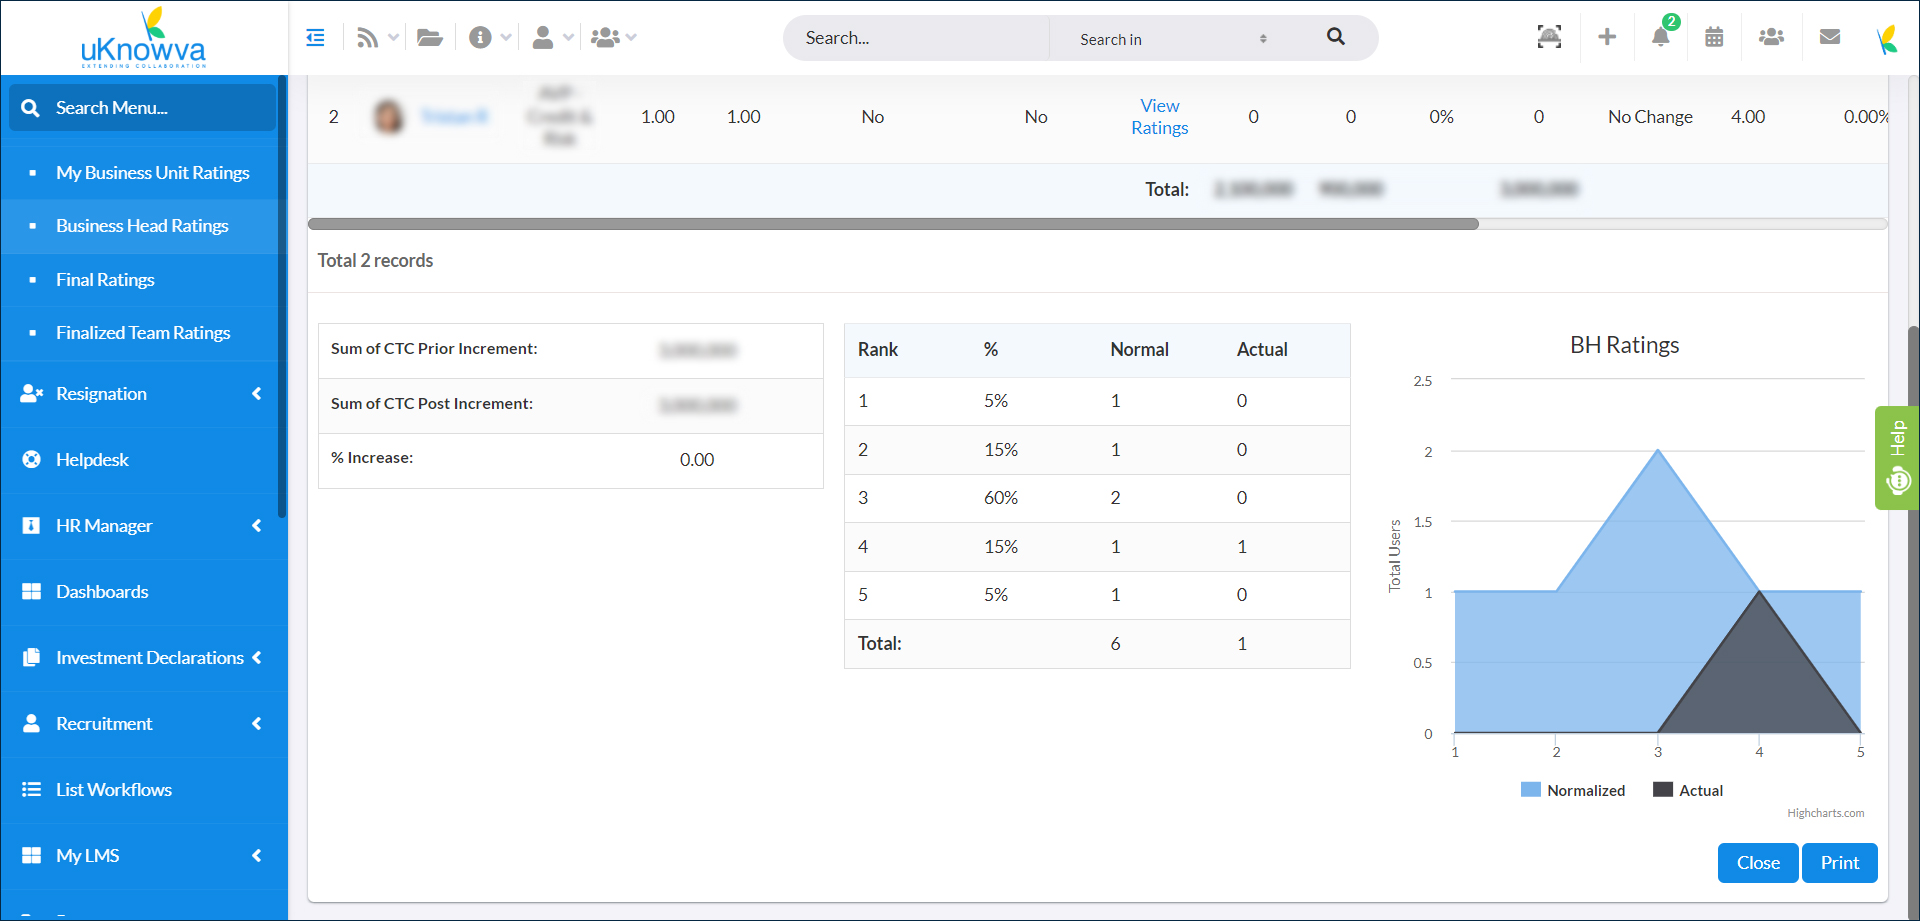
A bell curve is a graph that shows how values are distributed within a group. Most people or results fall in the middle, while fewer fall at the very high or very low ends, creating a shape that resembles a bell.
In performance appraisal, a bell curve is used to distribute employee ratings across different performance levels. Employees are grouped into categories such as high performers, average performers, and low performers based on their evaluation results.
Organisations use the bell curve to create a structured performance rating system and differentiate between varying levels of employee performance. It can help managers make decisions related to rewards, promotions, and development plans.
A bell curve is symmetrical, with most values concentrated around the centre. The number of observations gradually decreases as you move toward either end of the curve, representing fewer extreme outcomes.
The mean represents the average value and sits at the centre of the bell curve. It acts as the point around which most data is distributed and helps determine how far individual values differ from the average.
Employees are typically grouped into performance categories such as top performers, average performers, and low performers. The largest group usually falls in the middle, while smaller groups are placed at the higher and lower ends of the performance scale.
The bell curve can help standardise performance evaluations, reduce rating inflation, identify top talent, and highlight employees who may need additional support or development.
A normal distribution is a statistical concept that describes how data is distributed around a mean. A bell curve is the visual representation of that distribution. In everyday usage, the two terms are often used interchangeably.
Its use has declined in many organisations. While some companies still use it for performance differentiation, others have moved to continuous feedback and goal based performance management because forced ranking can sometimes affect employee morale and collaboration.
Best Practice:
Do uKnowva HRMS for a fully customisable and configurable representation of the bell curve. Use it well to spot the best performers in your team and set the normalisation rate according to the company policies without hassle.